
Hi, I'm an information systems techie who loves a challenge. And when that challenge brings out the best in software, even better! Plus, I also like to share. [Note: all data used/displayed within my report screen prints is fictitious]
Showing posts with label Dashboard. Show all posts
Showing posts with label Dashboard. Show all posts
Behaviour Analysis + Maximised Widget = One click reporting
School: "Can we save the report parameters so we don't have to set them each time we run it?"
Progresso Geek: <thinks.....> Hmm <thinks a little more....> Yes. By making the report a widget and maximising it on it's own dashboard you can.
A nice new feature of Progresso enables maximised widgets to remain maximised when returning to the dashboard they are on. So once you've logged on, click "Once" on the dashboard of your choice and there's your report complete with saved parameters.
The example below is a simple behaviour analysis (graph & table) that allows users to view behaviour entry totals by data range, year, reg group and behaviour types. Simply save the report to your school, create a widget linking to the report and then place it (maximised) on a dashboard all on it's own.
Try experimenting by selecting only one behaviour type, or making 3 dashboards (one for each term).

Here's a widget to quickly show students attainment levels
Information systems are all about providing information and not just entering information (or they should be).
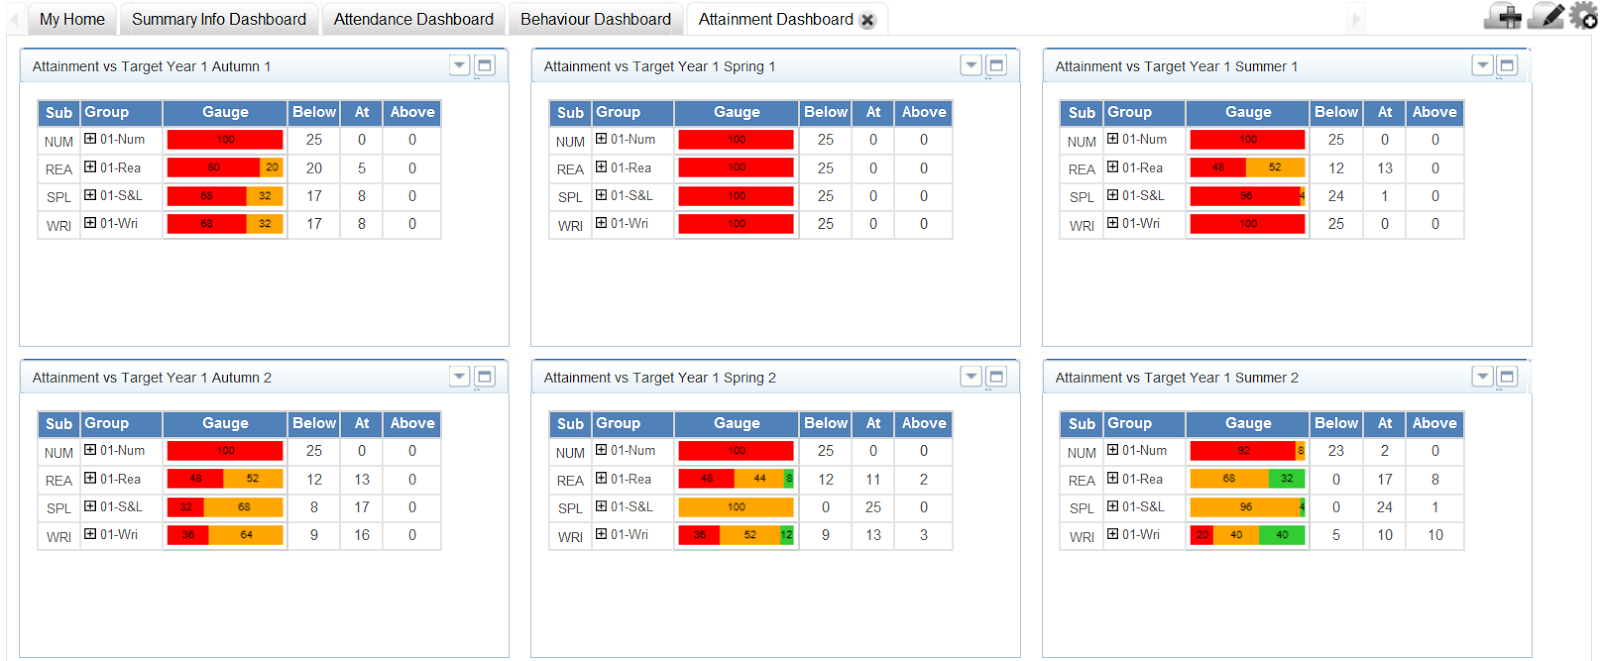
Here's a widget that will simply display attainment levels against a target for selected group(s) and identify those above, at and below. Furthermore, each group can be expanded to show the individual learners and the number of points difference from the target (plus SEN and Pupil Premium identifiers)
How can this widget be used?
It could be used on a primary teachers dashboard as a method to quickly remind the teacher which children haven't met their target by displaying the latest recorded results (so that the teacher can allocate their resources accordingly)

It could be multiple times on an SLT dashboard showing a summary of progress for an entire year group.
Here's a widget that will simply display attainment levels against a target for selected group(s) and identify those above, at and below. Furthermore, each group can be expanded to show the individual learners and the number of points difference from the target (plus SEN and Pupil Premium identifiers)
How can this widget be used?
It could be used on a primary teachers dashboard as a method to quickly remind the teacher which children haven't met their target by displaying the latest recorded results (so that the teacher can allocate their resources accordingly)
Cluster Reporting Widgets
I've had to revisit a number of my widgets so that they can also run at cluster level for individual schools within the cluster. A few hours work but it was worth the effort.


Below is a Progresso Cluster User Dashboard which uses 2 widgets (previously posted on this blog) but the establishment parameter in each widget points at a different school within the cluster. Hey presto! I can see a summary of a number of schools on a single page.

But what about viewing many schools data within a single widget you ask? Well I call those true cluster widgets. The establishment parameter in these type of widgets is a multi-choice field, so you can select just the schools you want (e.g. only the primaries within my trust, or just the secondaries as displayed in the dashboard below - Starters and Leavers).
