
Hi, I'm an information systems techie who loves a challenge. And when that challenge brings out the best in software, even better! Plus, I also like to share. [Note: all data used/displayed within my report screen prints is fictitious]
Who's on Report Today?
As a teacher you may often hear the phrase "Can you sign my report card". However, this is usually at the end of the lesson, but would have been more helpful if mentioned at the start.

.PNG)
Well here's a widget that may help teachers know who's actually on report based on the teachers timetable. It will highlight the current lesson too.
A pre-requisite for this widget (apart from the selected member of staff having a timetable) is the creation of an Ad-hoc group.
Simply create an Ad-hoc group called "On Report" and assign the relevant learners to that group. Alternatively, if you want to have a weekly on report log, create an Ad-hoc group with the suffix "Week XX" (e.g. "On Report Week 01") and set the start and end dates of the group to that week. The widget will only list the learners in active Ad-hoc groups so you can set-up next weeks learners who are on report in advance.
.PNG)
Class Dojo Learner Import Tool
Class Dojo is a fantastic tool for primary schools to record daily behaviour through a friendly graphical user interface.
To help schools set-up next years class groups, here's a simple Progresso extract report/instructions to make the process easier.
Instructions
1. After downloading and installing the report (link above), run the report for the required groups you wish to export. (Note: you can use the Academic Year parameter to access next years groups).
 2. Highlight just the student names for one group (each group is on a different page if multiple groups are selected). To do this click and hold the mouse button down just before the first name and drag it to the end of the last name. Right Click on the highlighted text and select Copy.

 4. Complete the Year, Subject and Name of your class and choose Next.


To help schools set-up next years class groups, here's a simple Progresso extract report/instructions to make the process easier.
Instructions
1. After downloading and installing the report (link above), run the report for the required groups you wish to export. (Note: you can use the Academic Year parameter to access next years groups).
3. In Class Dojo select "Add a new class".
5. Select the "Copy/paste list" button within Class Dojo and then paste the students names you copied from Progresso in step 1. (There will be some line spaces in the list but they don't cause any issue).
6. Click Save and Next and then you should have your learners imported.
Repeat steps 2 to 6 for each group.
Gamification - An Awards Widget
Everyone likes recognition. Everyone likes Badges. Well here's a widget (maximised) that allows schools to filter to reg/teaching groups and display a summary of achievements for a date range.

Also, the report will show a Gold Rosette if the count is greater than a defined value (this is another changeable parameter within the report)


Also, the report will show a Gold Rosette if the count is greater than a defined value (this is another changeable parameter within the report)
You may need to do a little configuring of the behaviour set up if you are not using categories. Instructions are below.
Instructions:
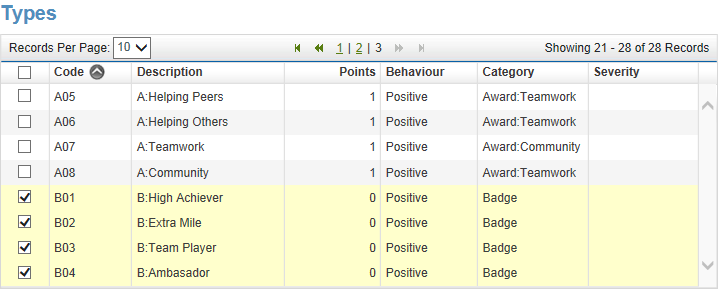
1. Make sure you have at least one category set up (I've called mine "Badges")
2. Assign this category to the behaviour types you want to count up.
3. In the report/widget setting you can now select behaviour types for a selected category.
"Photos by Group (Landscape 8x4)" Report
This report has probably been done before, but I wanted my version to fit on the screen and print out perfectly (A4 Landscape). I finally managed get it to fit correctly (about 30 seconds before launching my laptop out of the window) so it prints 8 x 4.
This is a pre-test before my next experiment with photos....

This is a pre-test before my next experiment with photos....
Behaviour Analysis + Maximised Widget = One click reporting
School: "Can we save the report parameters so we don't have to set them each time we run it?"
Progresso Geek: <thinks.....> Hmm <thinks a little more....> Yes. By making the report a widget and maximising it on it's own dashboard you can.
A nice new feature of Progresso enables maximised widgets to remain maximised when returning to the dashboard they are on. So once you've logged on, click "Once" on the dashboard of your choice and there's your report complete with saved parameters.
The example below is a simple behaviour analysis (graph & table) that allows users to view behaviour entry totals by data range, year, reg group and behaviour types. Simply save the report to your school, create a widget linking to the report and then place it (maximised) on a dashboard all on it's own.
Try experimenting by selecting only one behaviour type, or making 3 dashboards (one for each term).

"Hands up who's having school dinners"
In the latest release of Progresso is the functionality to record Meal Type choice. So here is a widget that can help the canteen know how many dinners to prepare (and how many are having other choices such as sandwiches).

Here's a widget to quickly show students attainment levels
Information systems are all about providing information and not just entering information (or they should be).
Here's a widget that will simply display attainment levels against a target for selected group(s) and identify those above, at and below. Furthermore, each group can be expanded to show the individual learners and the number of points difference from the target (plus SEN and Pupil Premium identifiers)
How can this widget be used?
It could be used on a primary teachers dashboard as a method to quickly remind the teacher which children haven't met their target by displaying the latest recorded results (so that the teacher can allocate their resources accordingly)

It could be multiple times on an SLT dashboard showing a summary of progress for an entire year group.
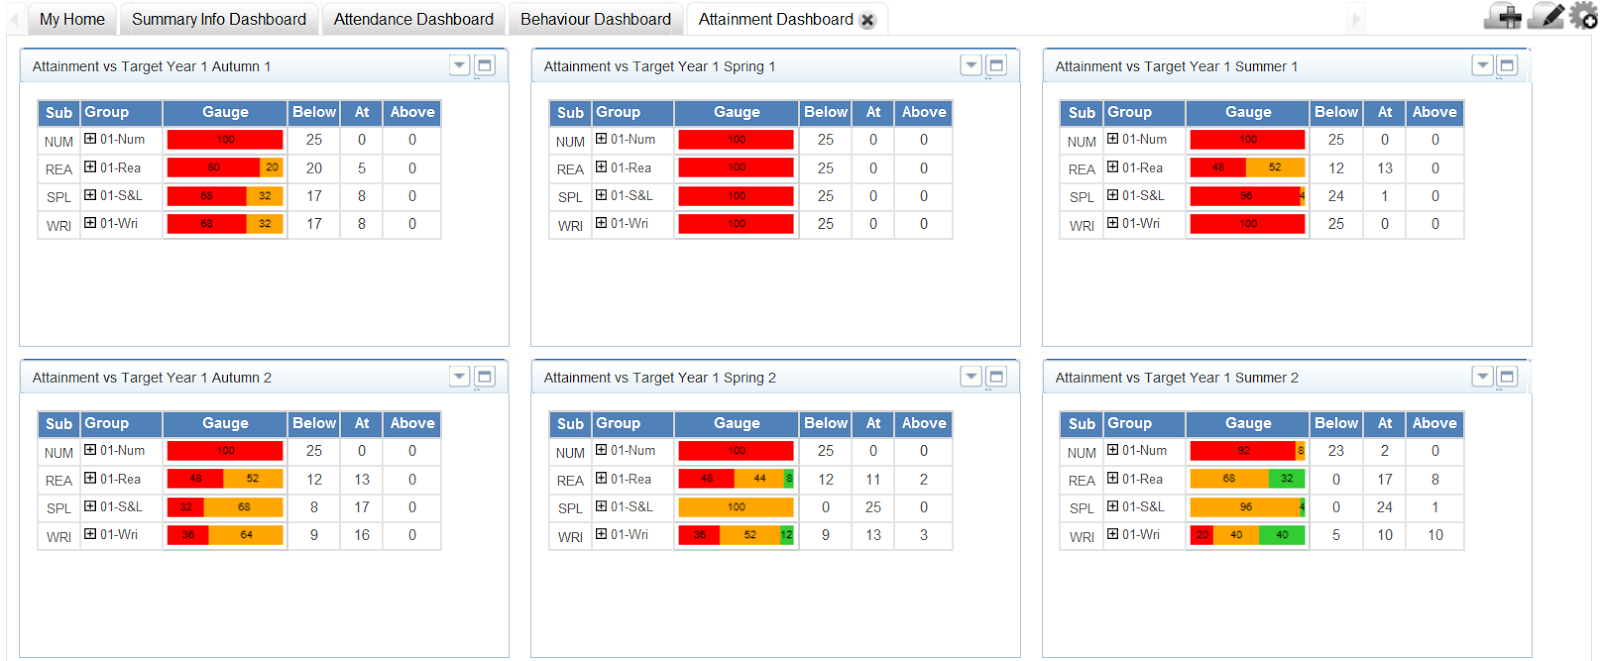
Here's a widget that will simply display attainment levels against a target for selected group(s) and identify those above, at and below. Furthermore, each group can be expanded to show the individual learners and the number of points difference from the target (plus SEN and Pupil Premium identifiers)
How can this widget be used?
It could be used on a primary teachers dashboard as a method to quickly remind the teacher which children haven't met their target by displaying the latest recorded results (so that the teacher can allocate their resources accordingly)
Free School Meals Summary by Review Date
Here's a simple little widget that lists the FSM reviews in chronological order and highlights any that have gone past their date (in red) and the ones to be done in the next 3 weeks (in green). Oh, and if the learner doesn't have a review date then these are also highlighted (in grey).

How big are your houses?
Do you want to quickly know which house to add new learners to so that they remain balanced?
Well here's a simple learner widget showing the total number of active learners assigned to each academic house by year.

Well here's a simple learner widget showing the total number of active learners assigned to each academic house by year.
Learner SEN Summary
Want to know how many of each SEN category in the school you have? You can also expand the SEN type as seen below to view which learners have that SEN type. Here you can see that the name has been set to a hyper link that allows you to go directly to their profile from the widget. Notice also that the same colour idea has been carried forward with the review dates as seen with the SEN Summary and Review Reminder widget.


Behaviour League Tables
There's nothing wrong with a bit of competition and here's a widget that will allow you to tally up the positive behaviour points for a date range by House and Year.


Keeping an eye on who is in school
Form tutors, with great ease this widget will allow you to view the attendance percentage for your tutees,
even providing a ranked list. Why not try and encourage some healthy
competition!
Alter the parameters/settings appropriately and this widget will also be great for Head’s of Year to keep an eye on all their learners without constantly reviewing attendance reports each week or even less regularly. Perhaps at the end of the year or each term, your SMT could view all the learners and easily identify and reward those at 100%. Remember every day counts!
Alter the parameters/settings appropriately and this widget will also be great for Head’s of Year to keep an eye on all their learners without constantly reviewing attendance reports each week or even less regularly. Perhaps at the end of the year or each term, your SMT could view all the learners and easily identify and reward those at 100%. Remember every day counts!

How has your registration/form group behaved today?
View today's, yesterday's, or the last 7 day's behaviour by registration group. In fact, add the widget twice to show positive and negative events. Or even create a SLT/SMT Behaviour Dashboard showing summary behaviour for each year group.
Build relationships further by commenting on positive behaviour in other classes. Make students aware that you know if they've had a poor lesson and provide support/sanctions.

Build relationships further by commenting on positive behaviour in other classes. Make students aware that you know if they've had a poor lesson and provide support/sanctions.
Staff Utilisation Report
Want to know the total hours timetabled for a selection of staff across a date range? Well here's a report that can help.


Cluster Reporting Widgets
I've had to revisit a number of my widgets so that they can also run at cluster level for individual schools within the cluster. A few hours work but it was worth the effort.


Below is a Progresso Cluster User Dashboard which uses 2 widgets (previously posted on this blog) but the establishment parameter in each widget points at a different school within the cluster. Hey presto! I can see a summary of a number of schools on a single page.

But what about viewing many schools data within a single widget you ask? Well I call those true cluster widgets. The establishment parameter in these type of widgets is a multi-choice field, so you can select just the schools you want (e.g. only the primaries within my trust, or just the secondaries as displayed in the dashboard below - Starters and Leavers).

SEN Summary and Review Reminder
With so much going on at schools today, it's easy to miss things. So why can't your MIS remind you?

Here's a simple little widget that lists the SEN reviews in chronological order and highlights any that have gone past their date (in red) and the ones to be done in the next 3 weeks (in green). Oh, and if the learner doesn't have a review date then these are also highlighted (in grey).

Attainment vs National Average
As an ex-teacher I remember having access to key information at the right time was always challenging. If I've entered the current assessment levels why can't I easily see it without having to navigate through the system?
Well here's a widget that just might help with that.
The Attainment vs National Average widget allows a user to select an assessment point (e.g. Year 4 / Autumn 1 / NC Level) and compares it to a specified level (e.g. National Average). The widget will produce a summary of the subjects with data recorded and identify the number of students that are below, at or above the set value. Furthermore, each subject can be expanded to show the individual students and their point difference.
The image below shows part of a dashboard that contains 2 of these widgets showing Autumn 1 and 2 entry points. This provides a quick view to see what levels of improvement has been made over the term.

Well here's a widget that just might help with that.
The Attainment vs National Average widget allows a user to select an assessment point (e.g. Year 4 / Autumn 1 / NC Level) and compares it to a specified level (e.g. National Average). The widget will produce a summary of the subjects with data recorded and identify the number of students that are below, at or above the set value. Furthermore, each subject can be expanded to show the individual students and their point difference.
The image below shows part of a dashboard that contains 2 of these widgets showing Autumn 1 and 2 entry points. This provides a quick view to see what levels of improvement has been made over the term.

I see you.... View today's users and their duration
Not all data in Progresso is manually entered. What about all that information collected in the logs?
I wanted to see if I could easily view who was logged on so I built this simple widget which looks at today's users and calculates how long they have been using the system.
It's surprising what other data is stored, such as the IP address. This gave me the idea to try out the SSRS feature to launch an external URL. So if you click on the IP address a new window will open that showing the users login location (that's if it's not hidden).
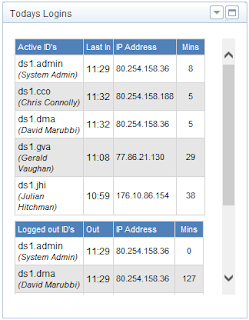
I wanted to see if I could easily view who was logged on so I built this simple widget which looks at today's users and calculates how long they have been using the system.
It's surprising what other data is stored, such as the IP address. This gave me the idea to try out the SSRS feature to launch an external URL. So if you click on the IP address a new window will open that showing the users login location (that's if it's not hidden).
